
PET preform mold capacity and blow molding capacity are two halves of the same plan. PET bottle production line capacity planning usually fails first. Why? Demand enters the plan unverified; machines get shortlisted by advertised speed. Then the peak month starves the line of preforms — or the plant pays for equipment it never fills. Start from the real annual demand instead: realistic efficiency, counted growth, machines last.
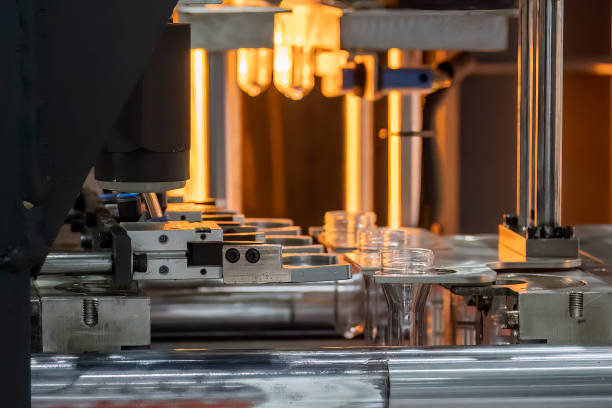
Quick Answer: How to Size a PET Bottle Production Line
- Capacity planning starts from qualified annual demand, not from machine hours: annual bottles ÷ production days ÷ daily operating hours gives the hourly target, and dividing that by OEE gives the rated capacity the equipment must actually deliver.
- OEE — availability × performance × quality — is where stoppages, mold changes, speed loss and rejects live, so equipment should be selected on the OEE-adjusted figure rather than a brochure speed.
- The slowest stage sets the line. Preform injection, blow molding and cap production must be balanced against the same number, and the mold cavity count has to match what the machine can really support.
Start with Annual Demand and Product Requirements
Define Your Annual Bottle Demand
What does the plant actually need in a year? Count bottles — not machine hours, not cavities. Keep forecasts, confirmed orders and pre-peak inventory apart; each behaves differently in a quiet or loud year. The target stays on qualified bottles.
Analyze Bottle Specifications and Product Mix
Every format gets its own line item: capacity, weight, neck finish, preform spec, annual volume per SKU. Why the detail? A 250 mL and a 2 L bottle share a blow station, but the molds, recipes and changeover times differ. Don’t add mixed formats’ theoretical speeds into one number
Convert Annual Demand into Daily and Hourly Production Requirements
Calculate Annual Operating Hours
Annual demand assumes the line runs 365 days — does it? Set production days and shifts per day, hours per shift, then take off planned maintenance and shutdowns.
Calculate Required Daily and Hourly Output
Daily Output = Annual Demand ÷ Production Days
Hourly Output = Daily Output ÷ Daily Operating Hours
The hourly figure is the target for qualified bottles at packing. A line averaging 8,000 good bottles an hour? It missed the 9,000 target.
Calculate the Required Production Line Capacity Using OEE
Understand Overall Equipment Effectiveness (OEE)
What separates the calendar from the floor? Availability is the share of planned time the equipment runs. Performance is actual speed against rated. Quality is the share that passes. Multiply the three — that’s the usable part of installed capacity.
Calculate the Required Rated Capacity
Required Rated Capacity = Annual Demand ÷ (Annual Scheduled Hours × OEE)
Select equipment by this result, not a brochure figure — stops, mold changes, speed loss and rejects sit inside the OEE factor. Trap: if the OEE already includes rejects, another scrap factor double-counts the loss.
| Step | Formula | 36 million bottle example |
|---|---|---|
| Hourly target | Annual demand ÷ (production days × daily hours) | 36,000,000 ÷ (300 × 16) = 7,500 bottles/hour |
| Rated capacity | Annual demand ÷ (scheduled hours × OEE) | 36,000,000 ÷ (4,800 × 0.8) = 9,375 bottles/hour |
| Preform output | Cavities × 60 ÷ cycle time in seconds | A 48-cavity tool at a 15 s cycle gives about 192 preforms/minute |
| Peak month | Worst-month demand ÷ (days × hours × OEE) | Size the line on the peak if stock cannot cover it |
Account for Seasonal Demand, Production Buffers, and Future Growth
Consider Seasonal Production Peaks
Annual demand hides the months that matter. Beverage orders swing; the monthly plan usually shows a peak or two carrying the sizing pressure. Convert the worst month the same way and compare.
Plan for Production Flexibility
Peaks can be absorbed by finished-goods or preform stock, an extra shift, or a line added later. Keep slots for mold changes and maintenance; leave growth room.
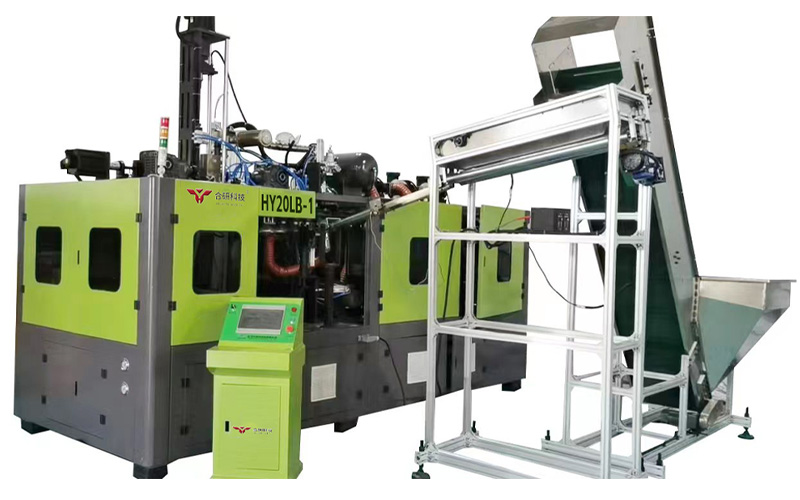
Choose the Right PET Bottle Production System
One-Step PET Bottle Production System
In one-step systems, injection and stretch blow molding share one machine — little preform storage in between. They suit high, stable volume, limited design range.
Two-Step PET Bottle Production System
In two-step layouts, preforms are molded first, stored, then reheated and blown. The buffer lets preform production and blowing run on separate schedules — useful for a wide format range.
How to Choose Between Them
Which system wins? Production data, not a rule of thumb — demand stability, bottle range, preform stock, investment, floor space. The votes aren’t equal. A wrong choice costs more than the price difference.
Balance Production Capacity Across Different Manufacturing Stages
PET Preform Injection Molding Capacity
Cavity count × 60 ÷ cycle time gives preform output per hour, before losses. So what must the tooling hold? The multi-cavity PET preform mold balances around preform weight, hot-runner flow and cooling — the injection molding system complete line program holds the same rate.
PET Bottle Blow Molding Capacity
The blow station is rated in bottles per hour, set by cavity number and cycle time. Reheat uniformity, stretch-rod sequence and cooling decide the realized rate — verify all three on the chosen bottle before the blowing system complete line program is finalized.
Bottle Cap Production Capacity
How many caps? The packaging bill of materials answers: one per bottle, plus rejects and capper losses. Settle cap mold and ring lifting mold cavity count and injection output against the closure spec and its buffer.
Identify the Production Bottleneck
Where does the line actually run? At the speed of the slowest stage — the fastest machine sets no pace. Injection and blowing on separate machines? Then preform stock absorbs the schedule mismatches and stoppages. Find the bottleneck, fix it, re-check.
Match PET Preform Mold Configuration with Blow Molding Capacity
Select the Appropriate Mold Cavity Number
More cavities multiply output per cycle. Each extra cavity asks for more injection capacity, more cooling, often a longer cycle. Count effective bottles per hour — not cavities on the drawing.
Check Machine and Mold Compatibility
Do clamping force, injection capacity, mold dimensions, cycle time, cooling and auxiliary equipment agree on one number? When they don’t, a fast machine behind an undersized mold just moves the problem elsewhere.
Practical Example: Calculate Capacity for 36 Million PET Bottles per Year
Say the plant must deliver 36 million qualified PET bottles a year.
| Parameter | Value |
|---|---|
| Annual demand | 36 million |
| Production days | 300 days |
| Working hours per day | 16 hours |
| Target OEE | 80% |
Multiply 300 days by 16 hours — 4,800 scheduled hours. Divide 36,000,000 by (4,800 × 0.8) and the required rated rate lands at 9,375 bottles per hour.
In plain terms, the equipment must carry at least 9,375 BPH rated. Verify it holds that speed on the target bottle, and price headroom for growth.
PET Bottle Production Line Capacity Planning Checklist
Collect before talking to suppliers:
- Annual bottle demand — and the monthly forecast behind it
- Bottle size, weight and design, per SKU
- Daily and hourly output, OEE-adjusted
- Shift pattern and realistic OEE
- Cavity requirements for preform, blow molds
- Injection and blow molding machine specifications
- Cooling water, compressed air
- Expansion plans, investment budget
Complete data gets an accurate configuration.
Plan Your PET Bottle Production Line with HEYAN TECHNOLOGY
HEYAN TECHNOLOGY builds custom preform molds, precision blow molds and multi-cavity cap molds to a defined output target, with complete line support. Send the annual target, bottle specifications and machine details — contact us with the three, and the configuration follows the real numbers.
Capacity planning works when it starts where the demand is — the annual number, real operating hours, OEE, every stage matched to that figure, room for growth. Bring the numbers to HEYAN TECHNOLOGY, and the molds and system get shaped around them.
Frequently Asked Questions (FAQs)
How do you calculate PET bottle production capacity?
Annual demand divided by scheduled operating hours is the base. Divide by OEE again, and the rated capacity the equipment must deliver shows up.
What affects the output of a PET bottle production line?
Machine speed, mold cavity count, cycle time, cooling efficiency and unplanned stoppages — the slowest of these sets the real output.
How do you match PET preform injection capacity with blow molding capacity?
Preform output must exceed the blow stage’s consumption plus losses; preform stock absorbs the schedule differences between the stages.
What OEE should I assume when planning a new PET line?
Use data from comparable lines rather than a target. Two-step PET lines commonly plan around 80% OEE, but the number has to include real stoppages, mold changes and rejects; check the assumption against shift records before fixing the machine size.
Should capacity be sized on annual demand or the peak month?
Size on the peak month when finished goods and preform stock cannot cover it. Annual average demand leaves the busiest weeks short, and covering them later usually costs more than the extra rated capacity.
